SEO · 7 min
Core Web Vitals: what they are and why they affect your sales
Core Web Vitals measure how fast your site loads, how much it shifts and how quickly it responds. Google ranks with them and your customers feel them.
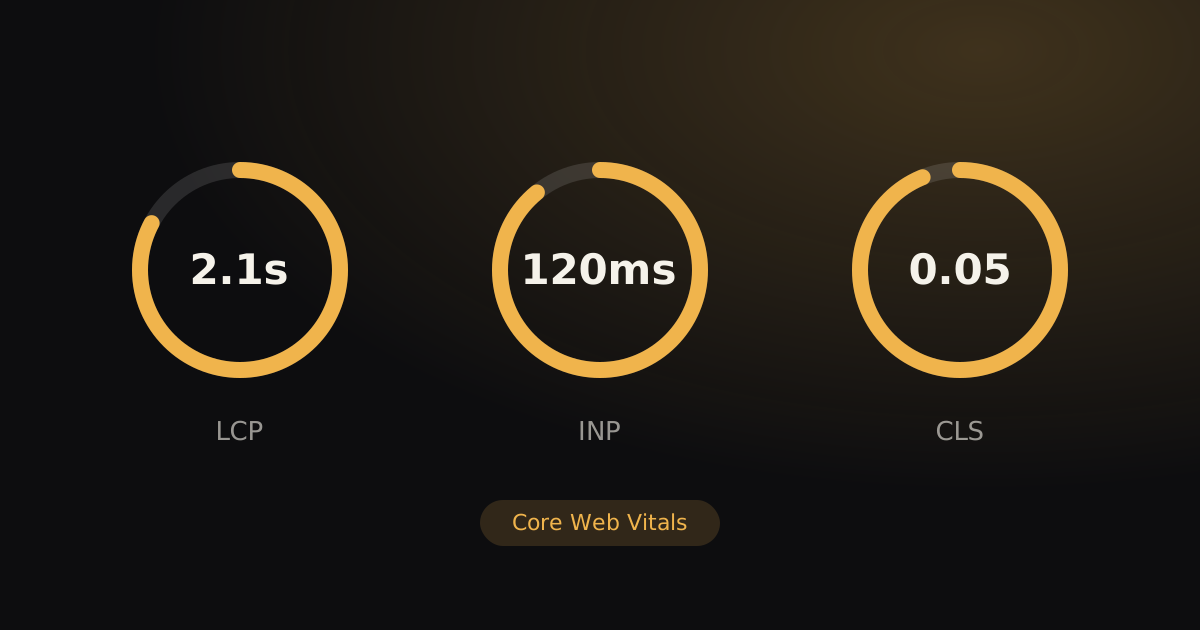
When someone lands on your site they decide within seconds whether to stay. Core Web Vitals is the name Google gave to three measurements that try to capture that first impression: how fast the content shows up, how stable the page is while it loads, and how quickly it reacts when you touch it.
The three metrics
| Metric | What it measures | “Good” value |
|---|---|---|
| LCP (Largest Contentful Paint) | How long the main element (photo, headline) takes to appear | up to 2.5 s |
| INP (Interaction to Next Paint) | How long the page takes to react to a tap or click | up to 200 ms |
| CLS (Cumulative Layout Shift) | How much the content jumps around while loading | up to 0.1 |
INP replaced FID in March 2024. If you read an older guide, that metric is no longer used.
On a real site:
- LCP is usually the cover photo, the main banner or the product image. It’s what visitors expect to see to decide whether they’re in the right place.
- INP is what you feel when opening the menu, filtering a catalog or tapping “Add to cart”. If the page is slow to react, people tap twice or leave.
- CLS is text that jumps because an image above it finished loading, or a notice that pops up and pushes everything down just as you were about to tap a link.
Why they affect your sales
- Ranking. Google uses them as a page-experience signal. They won’t make up for weak content, but between two similar sites they can tip the balance.
- Drop-off. A slow site gets abandoned before it shows the product. That is especially true on mobile with average connections, where most traffic comes from.
- Trust. A button that jumps right as you tap it (high CLS) or a menu that doesn’t respond (high INP) feels like a careless site.
What usually causes poor results
- Heavy images, or images without declared dimensions. The number one cause of slow LCP and layout shifts.
- Too much JavaScript: whole libraries to use one function, third-party widgets, chats and pixels that block the page.
- Late-loading fonts that make the text change appearance as it shows up.
- Slow hosting or no caching: the server takes too long to answer before the browser can even start.
- Bloated templates and plugins: many visual builders load the code for every feature they offer, even if your site uses two.
How to measure them
There are two kinds of data, and it pays not to mix them up:
- Real-user (field) data: how actual visitors experienced your site, on their own phones and connections, over the last 28 days. This is what Google uses for ranking. It only shows up if the site gets enough traffic.
- Lab data: a simulated test run on the spot. It’s useful for finding problems and checking whether a change helped, even if the number doesn’t exactly match what real users see.
Start with PageSpeed Insights: it shows both, real-user data at the top and the lab test with recommendations below. Always measure the mobile view and repeat the test after each important change.
If your site is in Google Search Console, the Core Web Vitals report groups your pages into good, needs improvement and poor. It’s the best way to see the whole site, not just the home page.
One important detail: Google doesn’t look at the average, but at what three out of four visits experience. If your site flies on your computer but crawls on a mid-range phone, that phone is what counts.
Where to start if your site is in the red
You don’t need to rebuild everything. In this order you usually get the biggest gain for the least effort:
- Images. Convert them to modern formats (WebP or AVIF), serve them at the size they’re displayed and declare their width and height. Often this alone fixes LCP and CLS.
- Third-party scripts. Check which pixels, chats and widgets are still needed. Every one you drop is code the phone doesn’t have to download or run.
- Fonts. Use fewer variants, load them earlier or fall back to system fonts.
- Hosting and caching. A server close to your visitors and cached pages cut the response time of everything else.
If the underlying problem is the platform or the template, there comes a point where optimizing costs more than rebuilding. That’s when it’s worth running the numbers.
Building it fast costs less than fixing it
Speed isn’t an extra you add at the end. It’s decided when you choose how the site is built, which images it carries and how much third-party code it loads. That’s why, when you ask for a quote, ask how performance will be measured before delivery.
How we approach it at Pipa Code
We build sites as static pages with optimized images and almost no JavaScript, and we check them with Lighthouse on every change. A high score isn’t decoration: it’s a condition for publishing.
If you want to know how your site is doing today, write to us and we’ll review it together.